Site search:
-
What’s new?
Energy for London Tags
Brent Buildings Camden Carbon Emissions CHP Cities Climate Adaptation Community Heating Community Initiatives Croydon Data DECC Decentralised Energy Distribution ECO Energy Costs Energy Efficiency Enfield FIT Fuel Poverty Funding Green Deal Hackney Haringey Housing Islington Lambeth Library Local Authorities Mayor Newham Ofgem Olympics Photovoltaics Planning RE:FIT RE:NEW Renewable Energy Retrofit Southwark Tower Hamlets Transport Waltham Forest Waste WestminsterEnergy Archives:
- February 2021 (1)
- January 2021 (15)
- December 2020 (15)
- November 2020 (9)
- October 2020 (3)
- August 2020 (5)
- July 2020 (3)
- June 2020 (4)
- April 2020 (10)
- March 2020 (5)
- February 2020 (2)
- January 2020 (3)
- October 2019 (1)
- September 2019 (4)
- August 2019 (2)
- July 2019 (1)
- August 2018 (1)
- November 2016 (8)
- October 2016 (8)
- September 2016 (2)
- August 2016 (8)
- July 2016 (14)
- April 2016 (12)
- March 2016 (16)
- February 2016 (8)
- January 2016 (4)
- December 2015 (1)
- November 2015 (1)
- October 2015 (16)
- September 2015 (3)
- June 2015 (1)
- May 2015 (1)
- April 2015 (1)
- March 2015 (1)
- February 2015 (1)
- January 2015 (1)
- December 2014 (18)
- November 2014 (4)
- August 2014 (8)
- July 2014 (7)
- June 2014 (25)
- May 2014 (8)
- April 2014 (4)
- March 2014 (12)
- February 2014 (7)
- January 2014 (13)
- December 2013 (11)
- November 2013 (15)
- October 2013 (15)
- September 2013 (18)
- August 2013 (5)
- July 2013 (20)
- June 2013 (33)
- May 2013 (8)
- April 2013 (16)
- March 2013 (25)
- February 2013 (14)
- January 2013 (20)
- December 2012 (23)
- November 2012 (23)
- October 2012 (25)
- September 2012 (14)
- July 2012 (12)
- June 2012 (43)
- May 2012 (20)
- April 2012 (8)
- March 2012 (40)
- February 2012 (39)
- January 2012 (40)
- December 2011 (22)
- November 2011 (40)
- October 2011 (33)
- September 2011 (48)
- August 2011 (40)
- July 2011 (58)
- June 2011 (41)
- May 2011 (80)
- April 2011 (38)
- March 2011 (33)
- February 2011 (25)
- January 2011 (24)
- December 2010 (3)
- November 2010 (7)
- October 2010 (6)
- September 2010 (7)
- August 2010 (1)
- July 2010 (2)
- June 2010 (4)
- May 2010 (1)
- March 2010 (3)
- February 2010 (3)
- December 2009 (5)
- November 2009 (2)
- October 2009 (3)
- July 2009 (3)
- June 2009 (1)
- April 2009 (1)
- March 2009 (1)
- February 2009 (1)
- January 2009 (1)
- December 2008 (2)
- October 2008 (1)
- September 2008 (1)
- July 2008 (1)
- March 2008 (2)
- January 2008 (2)
- October 2007 (1)
- September 2007 (3)
- July 2007 (1)
- March 2007 (1)
- February 2007 (3)
- November 2006 (3)
- August 2006 (1)
- February 2006 (1)
- May 2005 (1)
- February 2004 (1)
Tag Archives: Photovoltaics
Can green energy cooperatives help solve the UK’s energy challenge?
February 2013: Great event took place at the Hub in Islington this week discussing the question “could green community energy cooperatives play an important part in achieving a low-carbon, energy independent future for the UK?” which included speakers from Brixton Energy, Energise Barnet, Carbon Leapfrog and Southern Solar. A helpful write-up of the article is available on the Positive News website.
Brixton Energy and the Future of Community Energy Schemes
January 2013: Labour’s Shadow Energy Minister, Luciana Berger MP, recently visited the team at Brixton Energy to see the excellent work undertaken there in developing a community-led PV project. The scheme has been getting a lot of attention and was raised during a recent House of Commons debate on the Energy Bill, where it was refrenced as the kind of community energy initiative the Bill should be supporting – something which it is sorely lacking to do so at the moment.
The issue of the Energy Bill and community energy schemes – and the forthcoming Government Community Energy Strategy – was picked up again during the committee stage oral evidence sessions last week, with the Secretary of State being quizzed by another Labour Shadow Energy Minister, Tom Greatrex:
“Q 37 Tom Greatrex: I would like to ask the Secretary of State about community energy projects, because he has talked in the past about wanting to foster a community energy revolution. Will he explain why, contrary to the Select Committee’s report and other representations, he decided against increasing the threshold for the small-scale feed-in tariff above 5 MW?
Mr Davey: I know that there has been a lot of focusing on that. I would say first that community energy strategy is far wider, richer and deeper than simply that particular issue, although I know the Select Committee paid a lot of attention to it. Mr Barker and I will be publishing a consultation paper on a community energy strategy in March—I think that is the current working timetable. Mr Barker will correct me if I am wrong, but I think that we are working to March.
The Minister of State, Department of Energy and Climate Change (Gregory Barker) indicated assent.
Mr Davey: Yes. We would then hope to finalise that community energy strategy before the summer recess, or it might end up going into the autumn. The community energy strategy will cover many more issues than the one that you have identified.
Q 38 Tom Greatrex: This strategy will be after the Bill, though, so the opportunity to increase that threshold, if that were an appropriate thing to do, is therefore lost.
Mr Davey: The Bill is before the Committee. Of course, we keep those things under review, but let us be clear that the Bill’s major focus is not on community energy. It is about many other things, as we have been discussing. As you will be aware, community energy does not have to go into this Bill. As I have said, it goes much broader than the particular point that you are focusing on, important though that is.
Q 39 Tom Greatrex: But the thresholds for where the small-scale tariff and the contract for difference come in are in the Bill, are they not?
Mr Davey: Let us be clear. In our discussions on that, the vast majority of community energy schemes that we are seeing are below that threshold.
Q 40 Tom Greatrex: Because that is what the threshold is. That is why they are below it. It does not follow that they would not be—
The Chair: Just let him answer the question.
Mr Davey: To invest in bigger schemes than that, you need quite a significant amount of money. You are talking about several more millions than most of the communities will be putting in. When you get to that size of scheme, there is a question mark about how much of a community scheme it remains. There is no science here. I cannot say absolutely that that is the right threshold. There is a legitimate debate to be had about it. I am not pretending that there is not a legitimate debate, but one can slightly over-egg the pudding and not see the overall picture of what we are trying to achieve with community energy.”
Though the Minister is right with respect to London -that we have not as yet seen community-led schemes of the MW size/millions investment – there are however such projects now going ahead elsewhere in the country which are likely to be the pathfinder schemes for other similar initiatives – including ones hopefully in the capital. An excellent scheme worth mentioning is the West Mill Solar Co-op, recently launched in Oxfordshire, which is spread over 30 acres with more than 20,000 solar panels!
Posted in News, Renewable Energy
Tagged Community Initiatives, DECC, Lambeth, Photovoltaics
Leave a comment
Comparing PV in London to other regions
January 2013: With the publication of Ofgem’s new FITs newsletter (Quarterly Report 10 – December 2012 which looks at data up to September 2012) – it’s useful to look at back at the data over the past 10 issues and see how the capital has been faring under the programme with respect to most appropriate of the FIT technologies – photovoltaics (ie PV or solar electric). It should be noted that PV makes up 98% of FIT installations and 90% of total FIT generation capacity installed (see the newsletter for full details).
Previous posts (here and here) have looked at various FIT data sets and highlighted the fact that London has had the lowest capacity of PV installed of any region.
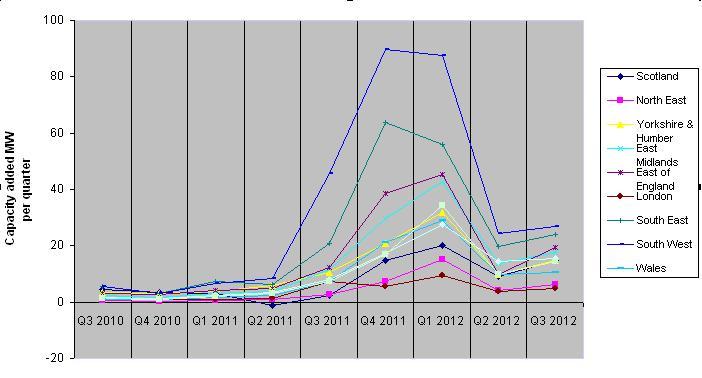
Plotting the installation rates of PV capacity per region per quarter (as provided by data in the Ofgem newsletters) since the FIT programme started (April 2010) provides a comparison of not only how low London’s capacity is compared to other regions of the country (London is the line skirting along the bottom, just below the North-East), but also how the various regions reacted to the sudden and major change in FIT tariffs (a good summary of which is in the following Guardian article).
The majority of regions witnessed a significant’spike’ in the number of PV systems installed as a result of the Government’s announcement that there was to be an near-immediate reduction in the FIT tariff level for PV. However, in London, though there there was an increase – it was incredibly modest compared to nearly all other parts of the country. Does this reflect:
- A low level of interest in PV by Londoners?
- More renters and more flats in London reducing demand for PV?
- Perhaps only a small number of companies are offering PV in the capital?
- Less knowledge in the benefits of PV by Londoners?
- Or are PV companies more attracted to doing business outside London – ie cheaper staff, less hassle factor, easier to put up scaffolding etc etc – more installs mean more money for them?
Whatever the reason, the potential of the most appropriate of the renewable technologies for London is currently being unrealised. The GLA’s 2012 London renewable energy study estimated that PV has the technical potential to supply up to 19% of the capital’s electricity consumption.
NB More recent data – up to December 31 2012 – is available in Ofgem’s latest FIT register database of 8 January 2013 (link to the Excel spreadsheet here – it’s a big file at 39MB with around 350,000 separate entries for FIT installations across the UK). The database indicates that of the 31MW of PV capacity in London, the vast majority – around 27 MW – comes from small scale household installations.
Posted in Decentralised Energy, News, Renewable Energy
Tagged Distribution, Photovoltaics, Renewable Energy
Leave a comment
Shining a light on solar power and renewable energy in your classroom
January 2013: Guardian feature on efforts to teach energy issues by a school in Enfield. Shining a light on solar power and renewable energy in your classroom
Deputy headteacher Julia Clarke has designed eco resources to take her school one step closer to a sustainable future. Full story here.
The Energy Bill misses out “opportunity to support community energy co-operatives”
January 2013: Newly elected Labour MP for Croydon North, Steve Reed, made a welcome intervention in the December parliamentary debate on the Energy Bill correctly stating that the Bill “misses an opportunity to support community energy co-operatives”. As an example of what can be achieved by such schemes, Mr Reed gave details of the Brixton Energy project:
“Brixton solar energy 1 was the country’s first urban energy generation co-operative and was set up by the local community in Brixton, working in co-operation with the local authority, Lambeth council…Brixton solar 1 was built on the roof of a social housing estate, Loughborough Park in Brixton. Brixton solar 2 is being built on another part of the same estate and a third scheme is planned for another estate in the area. The schemes are funded by community subscription and offer a 3% return to investors, most of whom are local. They are part-resourced by the local authority, which makes the buildings available.
“Instead of supporting such schemes, the Bill offers smaller community generators lower market prices for their power, making them less financially viable, and it fails to recognise the administration costs needed to run them. The Bill also ends the renewables obligation, which means that suppliers have no incentive to purchase from independent generators such as Brixton solar energy.
Mr Reed should be familiar with the scheme as, until his appointment to Parliament, he was the Leader of Lambeth Council. He goes on to conclude with some really good recommendations:
“The Bill should be amended to increase the fixed feed-in tariff threshold for community projects, guarantee a market for community energy schemes and set a minimum annual target for new generation capacity from community schemes. I should like to see local authorities incentivised to lower overall household carbon emissions in their area, which they could do in part by supporting projects such as Brixton solar energy.”
Further detail on these can be found in some excellent research by Cornwall Energy undertaken for Co-operatives UK and published a few months ago.
It should be noted that Scotland has had a target since 2011 of 500 MW community and locally-owned renewable energy by 2020 (see here for details).
Posted in News, Renewable Energy
Tagged Community Initiatives, Croydon, energy bill, Lambeth, Photovoltaics, Renewable Energy
1 Comment
London energy data maps
January 2013: Tim Starley Grainger has posted some useful graphics on how London is faring under some key Government energy efficiency and renewable energy programmes, such as CERT, Warm Front and progress under the Feed in Tariffs (FITs). As highlighted in various posts on this site, it doesn’t make for cheerful viewing. Graphics posted here.
FIT: Draft Guidance for Community Energy and School Installations
December 2012: Ofgem draft guidance document, open for consultation. It provides specific guidance for solar PV community energy and school installations on how to benefit from provisions available for the FIT scheme.
Further information on community energy and school installations can be found in the following DECC FIT FAQ document and the latest FIT rates here.
Waltham Forest has highest number of PV installations of any London borough
 24 October 2012: A recent post provided some regional detail of the uptake of Feed in Tariff (FITs) generators – predominantly photovoltaics (PVs) – across the UK (at the English regions and devolved administrations level). DECC have today released an updated spreadsheet providing a breakdown on the number of installations at local authority and parliamentary constituency level. This highlights that:
- London’s suburbs do the best in relation to PVs installed with Waltham Forest having the highest number of installs of all London boroughs (701); then Bromley (666), Croydon (525) and Havering (440).
- The parliamentary constituency of Walthamstow has accordingly the highest number of PV installations of any constituency in London (373). [For context, Tiverton in Devon has the highest number of installations of any UK constituency – 2,456]
- Unfortunately installed capacity (ie kWe of generation) by local authority/constituency is not available – which would be a more helpful metric (it is included available on a per installation basis in Ofgem’s comprehensive FIT spreadsheet (370k+ entries) – the latest of which was published a few weeks ago – and which Energy for London is currently going through and will report on shortly).
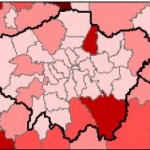
- A not very helpful map is also provided by DECC today of Number of domestic photovoltaic installations by Local Authority, as at end of September 2012
In addition to the direct link here the spreadsheet can also be downloaded from the following DECC FITs webpage (the file is called ‘Sub-regional Feed-in Tariffs confirmed on the CFR statistics‘).
Posted in Data Store, News
Tagged Bromley, Croydon, Data, FIT, Havering, Photovoltaics, Waltham Forest
Leave a comment
The World’s Largest Solar Powered Rail Station
Renewable Electricity Generation in London begins to grow
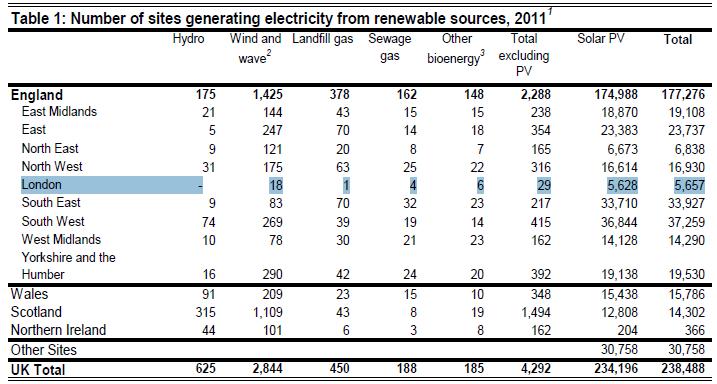
1 October 2012: DECC’s latest issue of Energy Trends includes new regional statistics on renewable electricity (not energy) generation. The article – Renewable electricity in Scotland, Wales, Northern Ireland and the regions of England in 2011– highlights (in Table 1) that 5,657 renewable electricity generating sites were operating in London as at the end of 2011. Not surprisingly the vast majority of these were photovoltaics (PV) – 99.48% to be precise – with a further 58 renewable technology schemes registered (this however compares with only 16 (non-PV) schemes as registered in last year’s statistics). The number of PV installations has risen more than fivefold compared to the number (1,044) in place at the end of 2010.
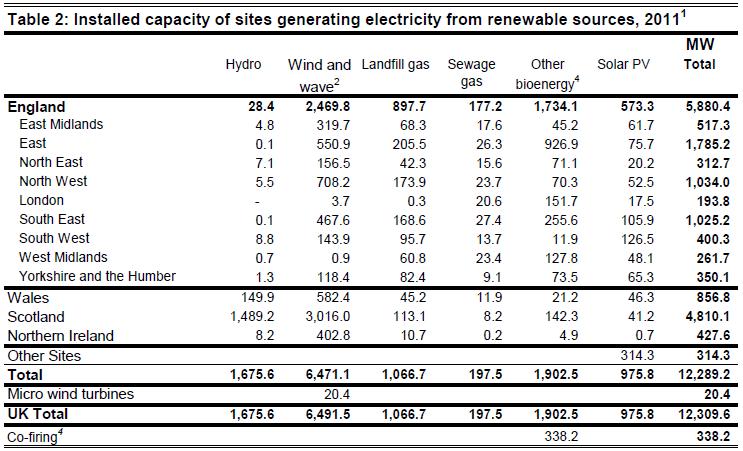
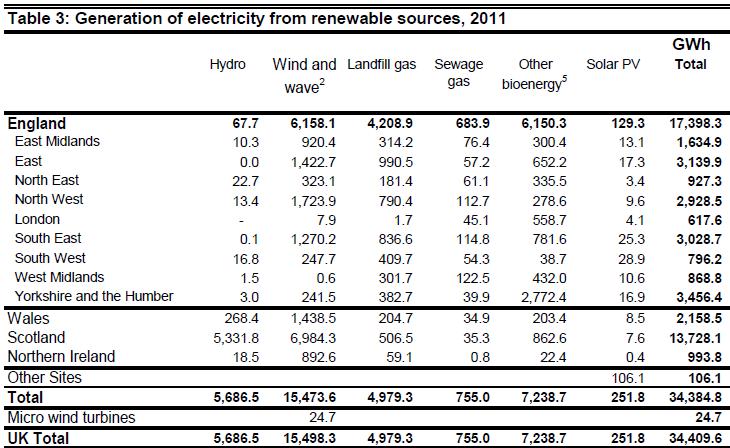
More importantly in terms of capacity and output, the following two tables (copied below) reveal that in 2011:
- London has 193.8 MW of electrical generating capacity (compared to 117.1 in 2010) – a 65% increase in renewable capacity over the year.
- PV capacity has risen six fold from 2.8 MW in 2010 to 17.5 MWas at the end of 2011
- However ‘Other biomass’ has seen the biggest overall increase in capacity – just over 40MW – over the year
- Oddly no sewage gas plants were registered in the 2010 statistics (a number of schemes have been operating in the capital for sometime…); it is now reported that 4 schemes operate in London to a total generating capacity of 20.6 MW.
- The ‘Wind and Wave’ category has increased by 8 in terms of installation numbers (10 to 18), however the capacity number remains the same – 3.7 MW – as of last year.
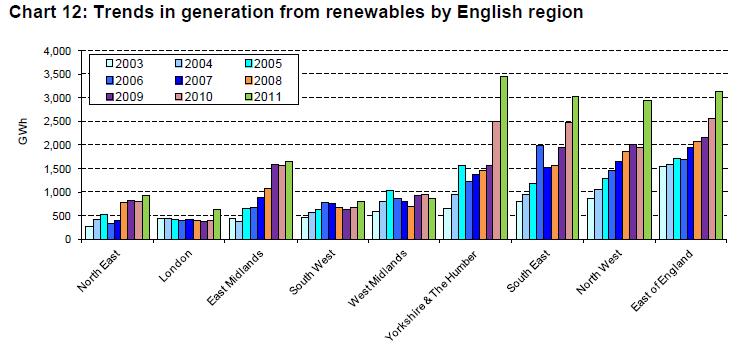
Following the level of overall renewable capacity added, there’s been a 60% increase in the amount of renewable electricity generated, rising from 385.7 GWh (gigawatt-hours) in 2010 to 617.6 GWh in 2011 (see table below).
The article provides further analysis and comparisons of London’s output as compared to the rest of the English regions, which, as is already well documented, remains modest due to the limitations the capital has in exploiting key renewable technologies such as wind and landfill. Chart 12 in the article (copied below) however provides some cause for optimism as it illustrates that changes made to the national policy framework for renewables over the past few years- particularly with the advent of Feed in Tariffs (FITs) and Renewable Obligation (RO) Banding – is finally supporting London to take a small but positive step forward in terms of its renewable contribution, after several years of only limited progress.
Posted in News, Renewable Energy
Tagged Anaerobic Digestion, Data, Photovoltaics, Renewable Energy, Waste
Leave a comment
FIT FAQ
June 2012: Confused by all the recent changes to the Government’s FIT programme? Here’s a FAQ document DECC have just posted online which goes some way to help explain…


